
 Facebook
 X
X
 Pinterest
 Copy Link
How Low Inventory Is Affecting the Housing Market

Windermere Chief Economist Matthew Gardner demonstrates how the U.S. housing market is adapting to low inventory levels. He touches on the new construction industry, supply changes in large metro areas, median home sale prices, and more.
This video is the latest in our Monday with Matthew series with Windermere Chief Economist Matthew Gardner. Each month, he analyzes the most up-to-date U.S. housing data to keep you well-informed about what’s going on in the real estate market.
Low Inventory Housing Market
Hello there, I’m Windermere Real Estate’s Chief Economist Matthew Gardner and welcome to this month’s episode of Monday with Matthew. As we are all aware, the housing market has softened considerably with the number of existing homes available to buy close to record lows. Today we are going to talk about supply, and how the market is starting to adapt to low inventory levels.
Housing Market Inventory
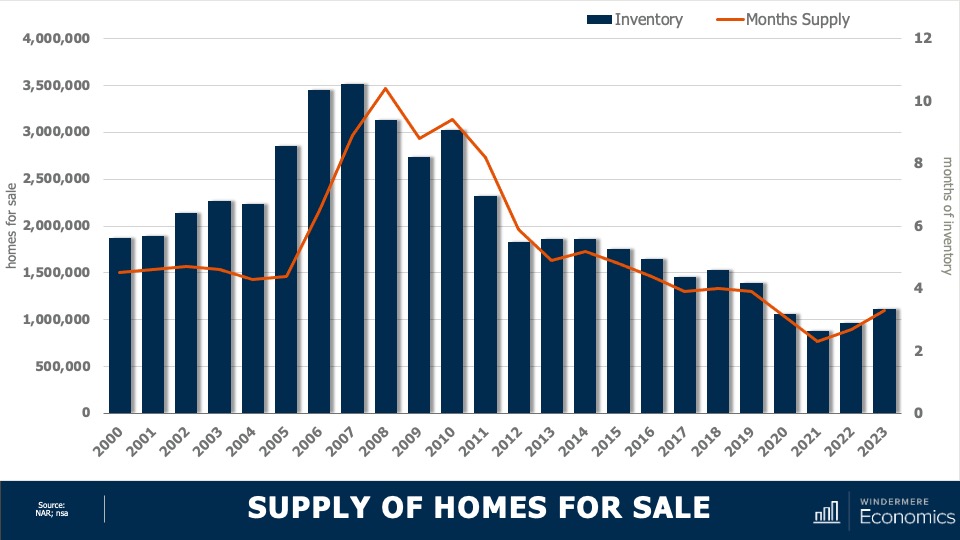
This chart shows the average number of homes on the market by year. Although year to date we have seen a little bit of an uptick, it’s clear the country remains supply-starved. And with just over three months of inventory—as opposed to the normal four to six—the market is clearly out of balance. But even though inventory levels have risen nationally, as I’ve said many times before, not all markets are equal.
Housing Inventory Changes in Metro Areas
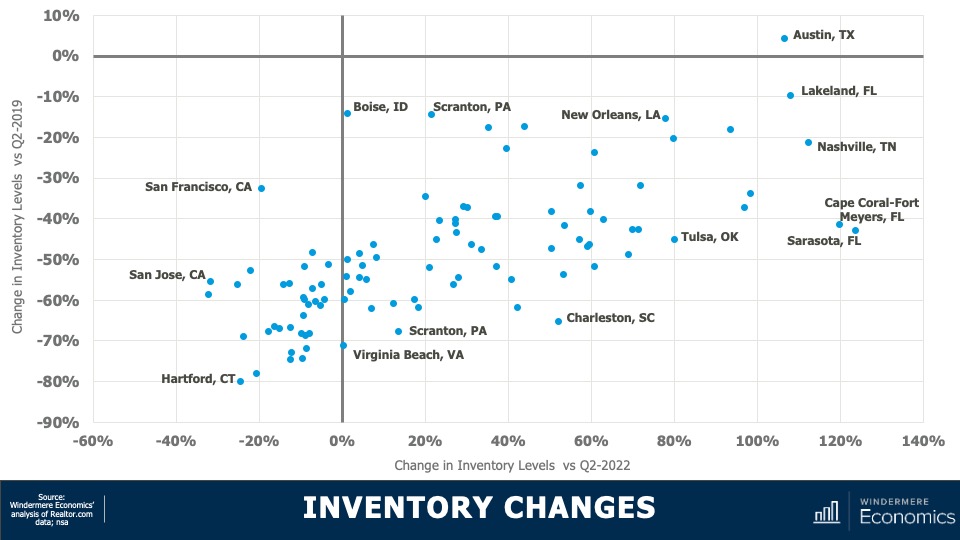
This chart shows how supply levels have changed. The data here is representative of the 100 largest metropolitan areas in the country. The horizontal axis shows the change in inventory versus the second quarter of 2022, while the vertical axis shows the difference and the number of homes for sale versus the second quarter of 2019. I think you’ll agree that the difference is stark. Although two-thirds of the metropolitan areas have seen the number of homes for sale improved versus the same period a year ago, just one (Austin, TX) had more homes for sale higher in the second quarter of this year than it had in the second quarter of 2019.
- And even more stark was the fact that inventory levels in 53 of the 100 largest metropolitan areas were down by more than 50% compared to the same period three years ago.
Interestingly, on a percentage basis, smaller metro areas saw the greatest decline compared to three years ago. For example, in Hartford, CT, the average number of homes on the market in the second quarter was just over 900, down by 80% from the second quarter of 2019 where there was an average of over 4,400 units for sale. Supply levels were down by 78% in Stamford, CT; 75% in New Haven, CT; and 74% in Allentown, PA.
It is true that supply levels are generally higher when compared to a year ago, with the greatest increase being seen in select markets in Florida, Tennessee, Texas, and Oklahoma; however, other than in Austin, supply levels remain well below their long-term averages. So, how is the market adapting? The answer is rather interesting. Even with all the talk of escalating material, land, and labor costs, it’s the new home industry that has been taking advantage of the lack of housing supply.
New Construction Market Trends
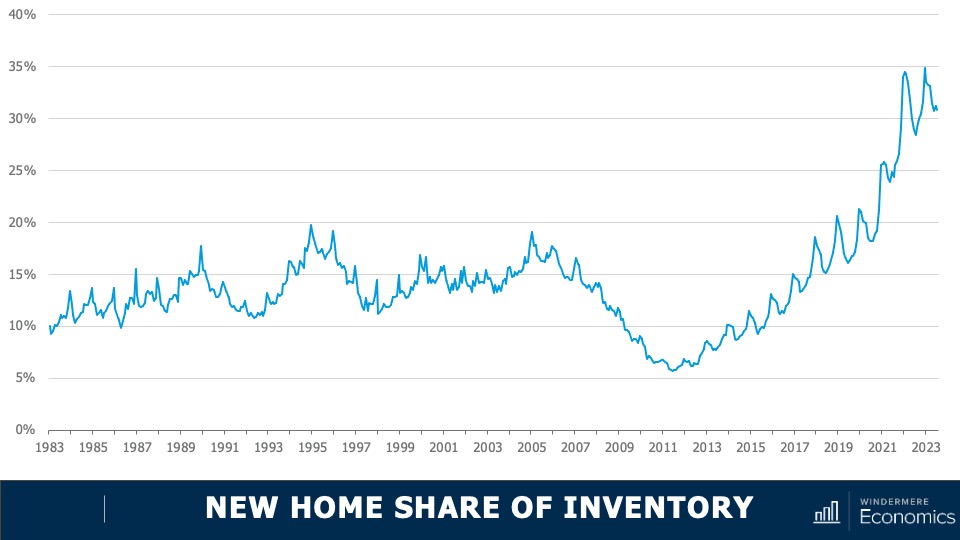
This chart shows the share of new homes on the market compared to their resale counterparts—here we are just looking at single-family homes. Historically, new construction makes up roughly 10% of active listings at any one time, but as you can see here, that share has been rising not just since the end of the pandemic but for the past several years. Although off the high seen a few months ago, 30% of the single-family homes for sale this July were brand new. I find this particularly interesting because, historically speaking, a premium was paid in order to buy a new home rather than an existing one.
Median Sale Prices: New and Existing Homes
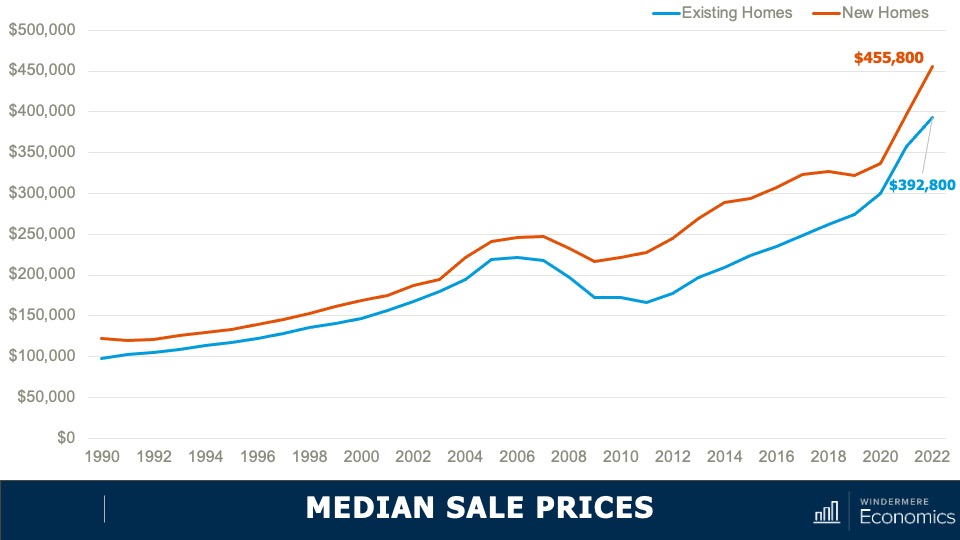
- As you can see here, the spread in median sale prices, which was pretty stable from 1990 until the bursting of the housing bubble, grew significantly starting in 2011 and in 2022. The premium averaged 16%. But when we look a bit closer at the numbers, they gives us a somewhat different picture.
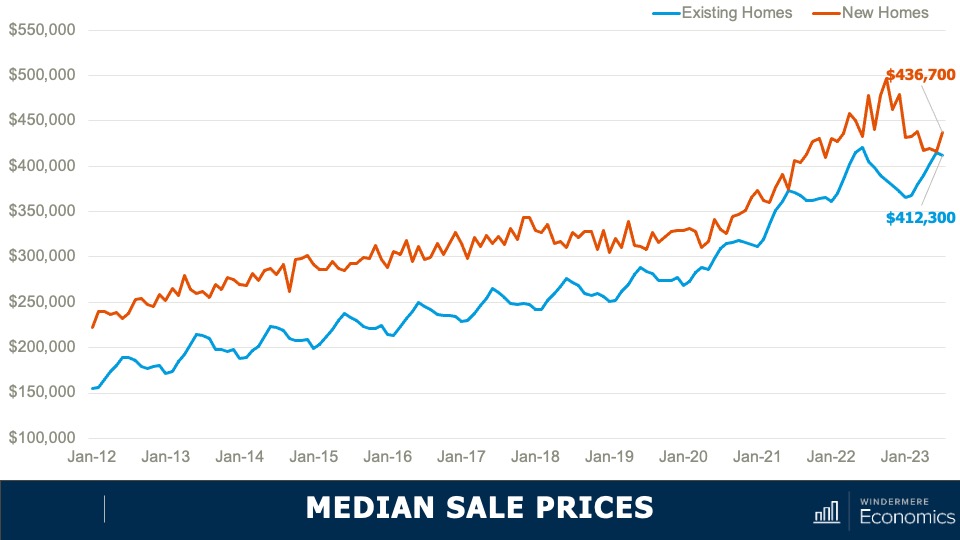
- You can see here the spread has dropped to just 6%. And in June of this year, the difference was a mere $1,000.
With the share of new homes for sale holding at a four-decade high, the share of sales themselves is at a level we haven’t seen since 2005. But even though we know that there is demand for housing, shouldn’t sales be constrained by mortgage rates? Well, what is happening is that builders are attracting buyers through incentives, and here we’re talking about mortgage rate buydowns which are becoming increasingly prevalent across the country.
In fact, a recent survey from John Burns Consulting suggested that 30% of home builders reported using interest buydowns more in the second quarter of this year than they had previously. And this is attracting buyers to visit new development communities.
An example of these buydowns is the 2/1 program that DR Horton—the largest home builder in the country—is offering at some communities. This program gives buyers a mortgage rate that starts at 3% for the first year, rises to 4% in year two, and then goes to 5% for the balance of the 30-year term. That’s pretty compelling, given where mortgage rates are today.
The bottom line is that as far as I can see, the new home industry will continue to take an outsized share of the market for the balance of 2023 and likely through most of 2024. That said, once the market starts to normalize, I expect them to pull back from these incentive programs, making them more likely to start raising asking prices, and we will return to the traditional spread between the prices of new and resale homes.
Although it’s pleasing to see more homes being built, I still believe that the country will still be running a housing deficit when it comes to meeting demographic demand and this will continue to hurt first-time buyers who continue to be priced out of the market.
As always, I’d love to hear your thoughts on this subject so feel free to leave your comments below. Until next month, stay safe out there and I’ll see you soon. Bye now.
To see the latest real estate market data for your area, visit our Market Update page.
About Matthew Gardner
As Chief Economist for Windermere Real Estate, Matthew Gardner is responsible for analyzing and interpreting economic data and its impact on the real estate market on both a local and national level. Matthew has over 30 years of professional experience both in the U.S. and U.K.
In addition to his day-to-day responsibilities, Matthew sits on the Washington State Governors Council of Economic Advisors; chairs the Board of Trustees at the Washington Center for Real Estate Research at the University of Washington; and is an Advisory Board Member at the Runstad Center for Real Estate Studies at the University of Washington where he also lectures in real estate economics.
